Anelastic Spectroscopy
Francesco Cordero -
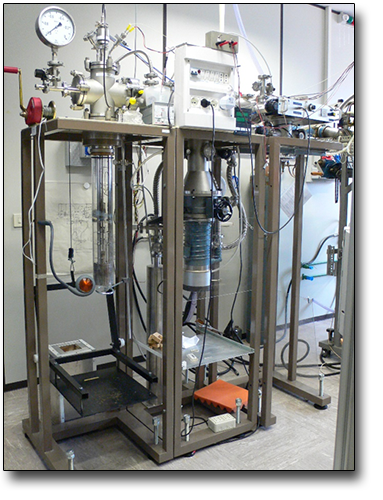
Laboratory of Anelastic Spectroscopy and Thermal treatments - AnelSpec
TECHNICAL SPECIFICATIONS
- Frequency range of the electronic apparatus, with signal analysed by a lock-in amplifier: 0.1--100 kHz
- high temperature: T = 100—1000 K
- cryostat: T = 1—300 K
- Microbalance Sartorius 0-5 g, resolution 2μg
- Manual press Atlas 15 ton
AVAILABLE TECHNIQUES
Anelastic Measurements:
- home made system for exciting the first free flexural modes during a same run, with frequences ideally in the ratios1/5.4/13.2 and fundamental of 0.1-10 kHz depending on the sample. Electrostatic excitation and detection with a frequency modulation technique using a single electrode close to the sample surface.
From the resonance frequency one deduces the Young’s modulus E; from the width of the resonance curve or the free decay one deduces the elastic energy loss Q-1 = E’’/E’ = tanɸ - System for measurements at high and LN temperatures
- System with cryostat with flux/bath of LN/He
Samples treatments
- UHV system with quartz tube heated by tubolar furnace (max 1100 oC) and all—metal section with calibrated volumes for annealing, degassing and doping controlled amounts of O or H.
- System in flux of O2 Ar+CO for oxyigenation or reductione with inductive heating in water cooled quartz tube.
- Press for obtaining bars and pellets from powders of hybrid metal—organic materials
- Microbalance
- Chemical fume hood
SAMPLES
-
bars 25-45 mm long and 0.2-2 mm thick
if non conducting, a pad in correspondnece with the excitation electrode and a strip for shorting the thermocouple are applied with Ag paint -
The high temperature measurements are done in high vacuum (10-6—10-5 mbar), those at low temperature in ~0.1 mbar He.
USED FOR
Phenomena:
-
any type of phase transition
-
mobility and aggregation of point defects(e.g. O vacancies or interstitial H) with selective measurement of the average frequencies for hopping or reorientation of the defects and their complexes
-
dynamics of extended defects, such as dislocations and domain walls;
-
rotational dynamics of molecules in molecular solids
-
small polarons and structural, magnetic and electric inhomogeneities or excitations.
Materials:
-
metals
-
semiconductors
-
ferroelectrics
-
magnetics
-
ionic conductori
-
molecolar solids
-
any type of solids
Case Studies
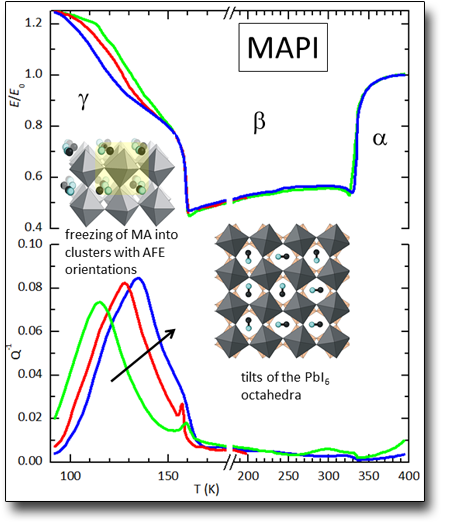
Phase transitions and dynamics of the MA molecules in the metalorganic perovskite MAPbI3.
The transition α-->β consists mainly of a rotation of the PbI6 octahedra about the c axis and therefore gives rise to a steplike softening of the elastic modulus. Also the transition β-->γ involves rotations of the octahedra, but the fact the the elastic modulus rises, and far above the value in the phase α, indicates an important contribution from the freezing of the rotations of the MA molecules. Much of this freezing occurs gradually with thermally activated and strongly correlated dynamcis, as demonstrated by the anelastic relaxation peak that shifts to higher T with increasing f and with broad shape.
See: F. Cordero, F. Craciun, F. Trequattrini, P. Imperatori, A. M. Paoletti and G. Pennesi, J. Phys. Chem. Lett. 9, 4401-4406 (2018)
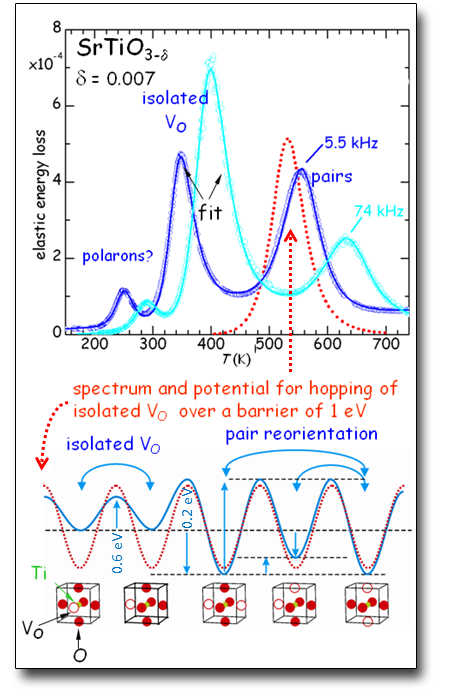
SrTiO3 is a model perovskite continuosly studied starting from the fifties and it was commonplace that VO up to concentrations δ of some percents are free of diffusing over a barrier of 1 eV, a belief often extended to other oxide perovskites. If so, (dashed red lines), the anelastic spectrum of SrTiO3-δ measured at 5 kHz would show a Debye peak in the dissipation centred at 550 K, whereas it is more complicated and the only peak at the smallest δ has an activation energy of 0.6 eV. Fitting a series of anelastic measurements at different δ it is possible to show that the isolated VO are much more mobile, with a barrier of 0.6 eV, but form relatively stable pairs and longer chains already at δ < 0.005. The activation energy of 1 eV is for the reorientation of the pairs, which also involves their translation.
See: F. Cordero, Phys. Rev. B 76, 172106 (2007)
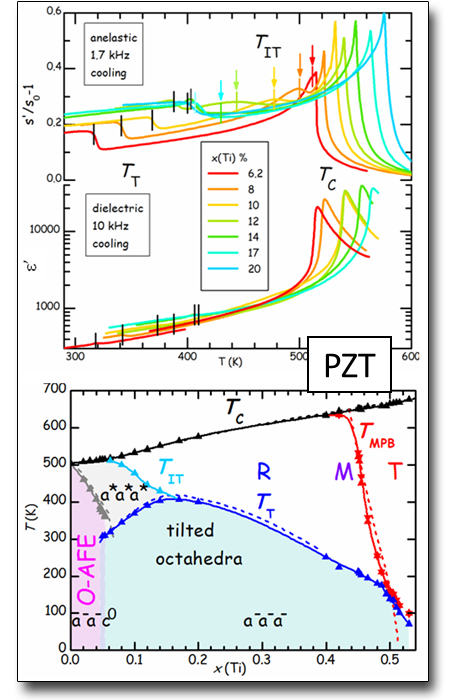
Phase diagram of the classic ferroelectric ceramics PbZr1‑xTixO3 (PZT)
PbZr1‑xTixO3 (PZT), still with the perovskite structure, revised after our anelastic (compliance s = 1/E reciprocal of the Young's modulus) and dielectric permittivity ɛ: TC is the Curie temperature, TT that for the rotation of the (Zr/Ti)O octahedra6. Both appear as steps in the compliance, since the order parameters of the two transitions, polarization and rotation angle of the octahedra, are quadratically coupled with strain (whose susceptibility is s). There is however another step at the intermediate temperature TIT, identified as the onset of the octahedral rotation without long range order and hence invisible with diffraction techniques and overlooked for over 50 years. The dashed lines are the generally accepted phase diagram of PZT without TIT.
See: F. Cordero, F. Trequattrini, F. Craciun and C. Galassi, Phys. Rev. B 87, 094108 (2013); J. Phys.: Condens. Matter 23, 415901 (2011).
 English (UK)
  Italiano (Italia)