This spectroscopy is a very straightforward tool to identify samples structures either crystalline or amorphous, as a film or adsorbed species, through their vibrational imprint. In practice, a laser beam emitting in the visible (for example as green light, λ = 514.5 nm) is focused on the sample surface and the scattered light, forming the spectrum, is analyzed. Lines of a Ne lamp are used for frequency calibration. To avoid sample overheating a low power density is used.
By Raman spectroscopy it is possible to obtain information a:
• Chemical composition
• Crystalline phase and Phase transitions
• Crystalline purity and structural disorder
• Nano-structured systems dimentions
• Stress and effects stress-inducted
• Defects and impurities
• Samples Temperature
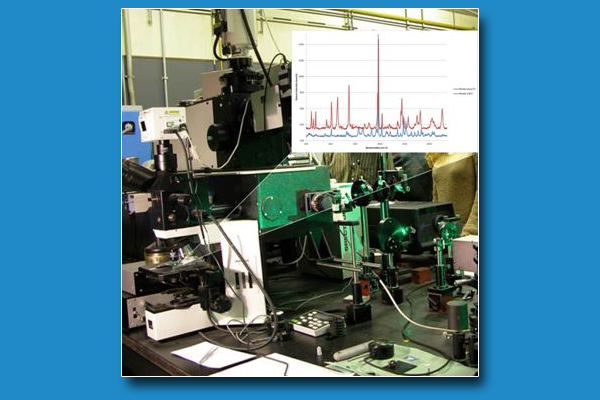
TECHNICAL SPECIFICATIONS
- Raman analyses are performed with a Dilor spectrometer, which allows macro- and micro-Raman measurements. The laser light is focused on a 0.2 mm diameter spot by an optical lens for macro-Raman, and on 1 µm, 2 µm, 10 µm in diameter spots (depending on the used lens: 100x, 50x, 10x) by an adapted Olympus microscope, for micro-Raman. The spectra are excited with an Ar+/Kr laser (the green line at 514.5 nm is preferentially used) at room temperature in back-scattering geometry. The Dilor XY spectrometer is equipped with a monochromator (grating 1800 lines/mm), a liquid nitrogen cooled CCD (Charge Couplet Device) detector and a Notch-filter (Notch-Plus, Kaiser Optical Systems)
AVAILABLE TECHNIQUES
- Raman peaks are fitted by GRAMS software (Galactic) with mixed Gaussian-Lorentzian functions to obtain frequencies position, intensities and FWHM.
SAMPLE
-
Sample dimensions: from 2 x2 mm (min.) to 200 x 200 mm (max.)
-
Sample thickness: 30-40 mm (max.)
-
Samples are directly loaded and transferred to measuring position
USE FOR
- Semiconductors;
- Molecules and adsorbed species;
- Crystals and amorphous solids, a-Si, argille)
- Thin-films
- Nanostructured and porous materials (e.g. ; Catalysts);
- Organics and Inorganics (e.g. pharmaceuticals, chemical industry);
- Plastics/Coatings
- Archeological interest materials (e.g. tuffs in Etruscan tombs)
Case Studies
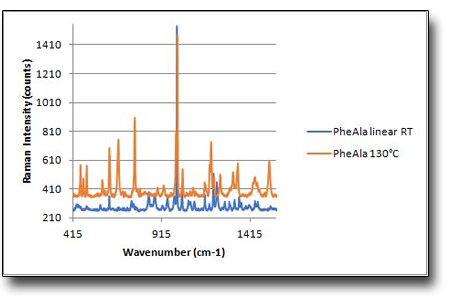
Raman spectra of Phenyl-alanylalanine samples shows signals of a transition from linear to cyclic form with water loss due to thermal treatment at 130°C.
Assignment of the Raman spectrum main features, indicates that α and β alanine forms coexist in the starting linear PheAla reference sample at RT. Moreover, it is possible to recognize the six characteristic phenyl group Raman lines, which remain almost unchanged after thermal treatment. This indicates that the phenylalanine structure does not change with temperature increase. Moreover, there are some changes in the Raman spectra finger print that is possible to attribute to the cyclization of the original open structure Phenyl-alanylalanine.
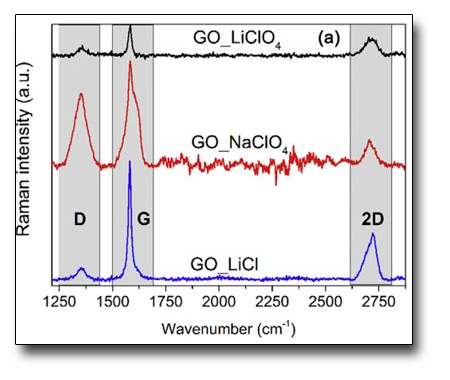
Graphene oxide (GO) obtained by electrochemical oxidation of graphite in different aqueous solutions of LiCl, LiClO44, and NaClO4.
All samples exhibit a G-band at around 1580 cm-1 and a 2D-band at 2700 cm-1, corresponding to the first-order scattering of the E2g vibration mode and the second-order two phonon mode, respectively, typical of graphene fingerprint. Moreover, a D-band is observed at 1350 cm-1, which is attributed to disorder-induced mode due to the presence of structural defects.
The intensity ratio of D and G bands (ID/IG) provides important information about the defects introduced on graphene surface and edges during the electrochemical exfoliation. Among the series of samples, GO_LiCl has the lowest ID/IG ratio indicating that this sample has the lowest defects content.
As already reported in the literature, Raman characterization confirms the correlation between the content of defects and the regularity in morphology of graphene sheets as evidenced, for example, by AFM.
See: M.A. Costa de Oliveira et Al. Journal of Power Sources 356, 381 (2017)
 English (UK)
  Italiano (Italia)