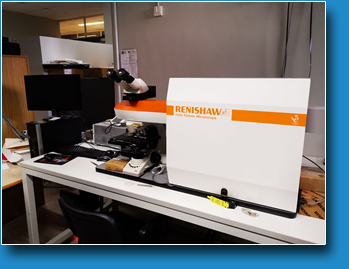
JMicro Raman InVia Renishaw with accessories
Barbara Paci -
Samples are located onto the proper holder, autofocus or manual focus system allow for the acquisition to be performed. Internal silicon reference is used to calibrate the apparatus (quick or complete).
Single Raman patterns can be obtained choosing a specific range of interest or in the whole explored frequency range. Instrumental parameters can be set manually depending on the experiment: number of accumulations, exposure time, laser intensity, grid lines etc.
In plane or volume maps can be collected selecting specific areas, number of points to be collected, using pre existing grids or varying the conditions depending on the experimental requirements.
All above mentioned procedures can be used to perform PL measurements or polarized Raman measurements. Patterns can be collected in reflection mode or in transmission (768cm-1)laser only).
The Wire 4.2 software allows for all necessary data refinement and adjustments to be performed (base line subtraction, cosmic ray removal etc.) and to data analysis (peak find, peak fit, creation of maps etc.)
TECHNICAL SPECIFICATIONS
- Laser 457cm-1 and laser 768cmm-1.
- Motorized system to perform 2D and 3D mapping of samples: 300nm in plane resolution and 1.5 μdepth resolution m su z (1 μm in high confocality).
- Hot-cold Linkam cell (-196 °C to 600 °C)
- Polarized Raman optics for both lasers and especial sample holder to perform in plane rotations.
- Photoluminescence optimized filters.
- 5X-20X-100X Microscope zoom with short focal distance and 50X zoom with a long focal distance.
- Wire 4.2 software for data anlysis.
AVAILABLE TECHNIQUES
-
Acquisition of traditional Raman spectra at high resolution and with great reproducibility (0.2 cm-1) ;
-
Raman images (2D mapping) – High accurate and resolved chemical images.e
-
Raman Volume images – chemical information on determined volumes of samples
-
Temperature dependent Raman measurements by means of a Hot-Cold cell .
-
Polarized Raman measurements.
SAMPLES
-
films max in plane dimension 15cm*15cm
-
powders
USE FOR
-
Chemical complementary analysis of thin films and powders being active to the Raman modes
CASE STUDIES
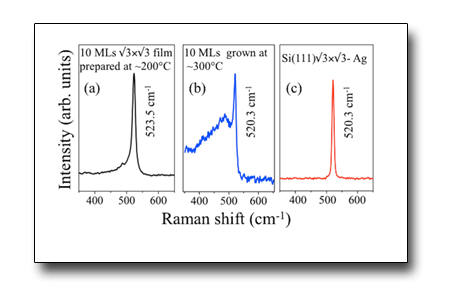
Multilayer silicene: clear evidence
Evidence of the synthesis of epitaxial√3Å~√3 reconstructed multilayer silicene hosting Dirac fermions was presented. We demonstrate by means of a comprehensive x-ray crystallographic study, along with STM, LEED, AES and Raman characterizations, that multilayer silicene is effectively realized upon growth at rather low growth temperatures (≈200 °C), while three-dimensional growth of silicon crystallites takes place at higher temperatures (≈300 °C). This transition to bulk-like silicon perfectly explains the various data presented and discussed in the literature and solves their conflicting interpretations.
See: P. De Padova, A Generosi , B Paci et al. 2D Mater. 3 (2016) 031011
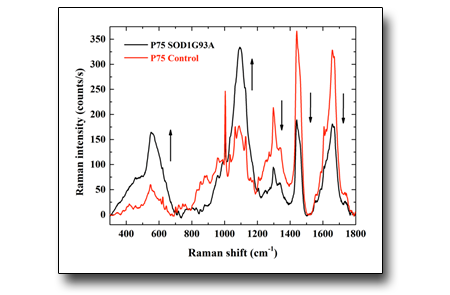
Here, high quality confocal Raman spectra from spinal cord tissue sections of mouse models were recorded for the first time using 457 nm laser excitation. Normally, lowering the wavelength of the laser source increases the cross section of the Raman process, as this is proportional to the inverse fourth power of the used wavelength. Fluorescence contribution may be lessened with extended laser exposure. This is achieved with minimal to no sample damage with concentrated power densities. The spectra from control, healthy mice and transgenic SOD1G93A mice were compared to assess the potential of Raman spectroscopy with 457 nm excitation for the early detection of the degenerative disease. .
See: G Picardi, A Spalloni, A Generosi, B. Paci et al, Scientific Reports (2018) 8:13110, DOI:10.1038/s41598-018-31469-4
 English (UK)
  Italiano (Italia)